Historical Tick Data
Complete Tick Data Bundle
We offer a single bundle of our entire historical tick data archive for stocks and ETFs.
(full ticker listing is available in the sample above).
Bundle Summary :
| Tickers : | 5000 stocks and ETF tickers. All Russell 3000 stocks (including S&P 500 stocks) plus 2000 most liquid ETFs. |
| Data Types : | Trade (executed trades) and Quote (Level 1 bid/ask quotes) |
| Updates : |
All data files are updated daily. Updates are live by 11.30pm for the current trading day. Purchase includes 3 months of free updates. Thereafter, an update subscription is $99.95 per month. |
| Data Access : | Web download (via the customer download portal) and API. Note the API serves zip archives of data files and not raw data. |
Product Overview
The tick data archive is a standardized and error-tested dataset of tick-by-tick trade and quote data dating from 2010. Trade data from the below exchanges are aggregated into a single series, providing a near-complete and high resolution trade sequence. The datasets are updated daily with the current day's data available by 11.30pm US Eastern Time. For efficient downloading, we provide two daily updated files for each ticker - Day (prior day's data), Month (current month with data up to the prior day).
The total archive is approximately 2.4 TB (2400 GB) in compressed zip format, or 24 TB (24,000 GB) as uncompressed data. See below for samples and data acccess details.
Exchange Coverage:
Nasdaq
NYSE
NYSE American
FINRA
Nasdaq OMX
NYSE National
Cboe
NYSE Arca
Investors Exchange
International Securities Exchange
Cboe BATS
Nasdaq Philadelphia
Data format is .csv (see below for samples) which is compatible with Excel, data analysis packages such as TradeStation, NinjaTrader, MetaStock etc and programming packages such as Python Pandas.
Data Access
For high-availability and fast download times all the data is hosted on Google's Content Delivery Network. There are two methods for accessing the data, the web-interface and via url (web address).
Web-Interface Data Access:
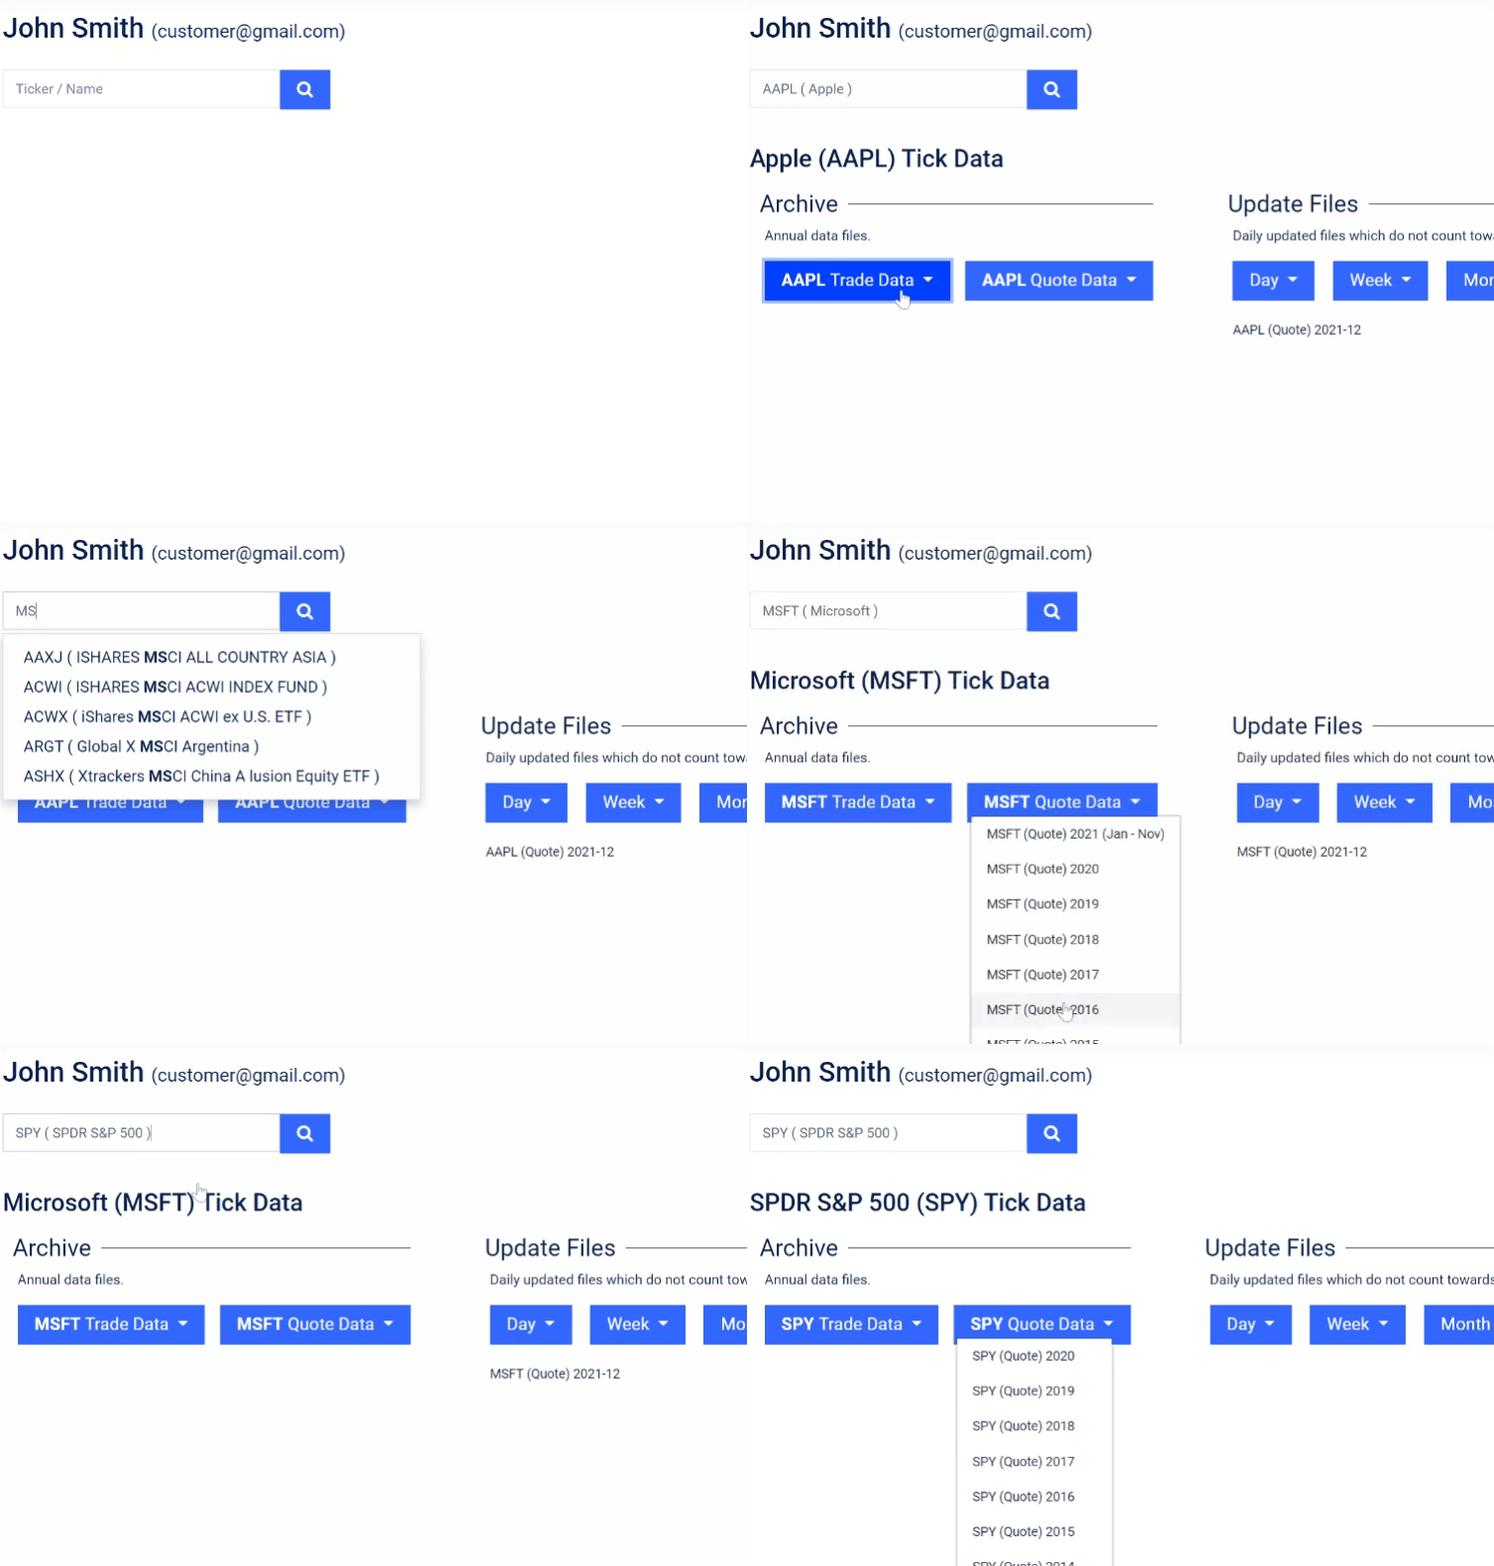
Via the web interface customers can enter the desired ticker or company name and then be provided with a dropdown of the zipped tick data files available for download, as below:

The annual archive files are organized as separate zip files, with each annual zip file containing 12 monthly csv files.
Url Data Access:
Although we do not offer a full API, we provide links in the below format for accessing both the annual archive files and the update files:
https://tick.firstratedata.com/c/{customerCode}/{ticker}/{trade/quote}/{year}
Please note that zip files are served via the links and not raw data.
Sample
Sample contains GOOG and MSFT trade and quote data for May 12, 2023, as well as details on the data format.
Understanding Tick Data
As a data vendor, we focus solely on historical intraday data for traders and institutions to use in strategy development or backtesting. Most traders begin building their strategies using intraday bars which are very useful for prototyping a trading strategy, however, for accurate backtesting and simulating real-world trading profits we always recommend using tick data
What is Tick Data?
Tick data is the highest resolution intraday data and is the sequence of each executed trade or bid/ask quote aggregated from multiple exchanges.
For example, below is a sample of stock tick data for AMZN on April 4, 2018.
(timestamp, price, volume)
2018-04-11 04:00:00:070,1434,5
2018-04-11 04:00:06:245,1431.91,100
2018-04-11 04:00:08:176,1430,1
Types of Tick Data
There are four types of tick data:
Trade tick data - the sequence of executed trades (as shown in the example above)
Bid/Ask (Level 1) data - the NBBO (National Best Bid and Offer) bid/ask quotes
Bid/Ask (Level 2) data - is the NBBO plus each registered dealer’s best bid and offer (ie the full order book)
Bid/Ask (Level 3) data - is only available to NASD member firms and comes with execution and amendment privileges.
How and Why to Use Tick Data.
The single biggest issue with developing trading strategies on bar data is it always overestimates the profits generated by the strategy. This is due to optimistic assumptions on trade entry and exit prices, many backtesting tools will assume that the trade can be entered close to the bar low or sold close to the high, however this is impossible to know if the only information is open, high, low, close, volume.
When the bid/ask tick data is incorporated into backtesting the strategy can realistically simulate the buying at the bids and selling and at the ask prices.
Another issue with bar data is that it obscures vital information on the buying or selling since all trading activity is aggregated into a single time-bar. Analyzing tick data can give insights into trading patterns, for example, several large volume trade ticks will likely indicate institutional trading whereas multiple small volume trade ticks can indicate retail involvement.
Tick data can also provide advance signaling of price activity, for example, the widening of the bid/ask spread accompanied by low trading volumes is often a precursor to a technical breakout of resistance/support levels.
Note that in the above examples, both trade tick and bid/ask tick data have been used. Trade tick data is useful in analyzing price trends and trading activity, however, as with bar data, it is difficult to accurately estimate trading profits from pure price activity alone. Therefore, we would recommend performing a backtest simulation using the bid/ask tick data to test actual entry and exit prices on trades.
Note that Level 2 data can also be purchased and gives extra signaling on future demand and supply, however, it is highly prone to manipulation as participants may place and withdraw large bids or offers to generate false signals.