Historical Options Data
Our end-of-day historical options dataset goes back to Jan 2010. Our data set includes the full historical option chain comprising both bid/offer quotes, bid/offer volumes, implied volatility (for both bid and ask quotes), close of day open interest, greeks, and last trade price.
The data covers over 5000 stock/ETF tickers as well as over 4000 delisted tickers (only tickers delisted after 2010 are included).
Data Format
Data format is csv which is compatible with Excel, data analysis packages such as TradeStation, NinjaTrader, MetaStock etc, and programming packages such as RStudio, or Python/Pandas.Data Sets
Currently we offer the below datasets :
Bundles
| End-of-Day Data Bundles |
|---|
| Historical Options Data Bundle (5800+ tickers) |
Understanding Options Data
Options data is far more dense and complex that standard equity market data due to the number of options for each underlying ticker as well as the unique features of an option.
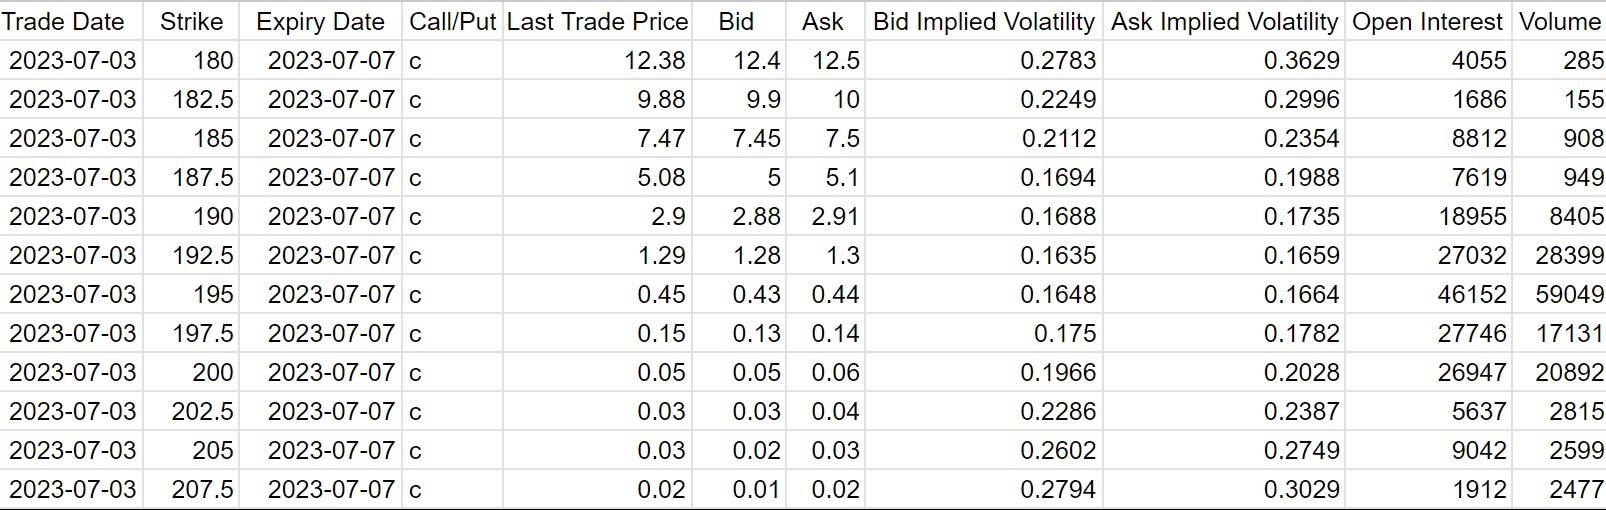
There are multiple ways to organize option data, we focus on option chains. An option chain is the full listing of all available options for a ticker ordered by expiry date and then by the option's strike price as below
One major difference with equity data is that with options data analysts will normally favor quote data over executed trade data. As option volume is spread across numerous outstanding option contracts (as opposed to concentrated in a single ticker for equity data), the traded price data is often stale and not representative of the current market. Quote data solves this issue as quote data is always current since it can be executed against. An important caveat to using quote data is that the volume of the quote can be very low giving a misleading indication of the market price (as the quotes with higher volume in the stack can be at very different price levels).
Using quotes can also help estimating the slippage cost of executing a trade as the trade prices may not represent the actual price level a trade can achive.
Although the price data can be useful, implied volatility is the typical metric used for options trading as the implied vol is comparable between different options contracts and can also be used for creating vol surfaces or skews to evaluated value across the entire option chain.
In reality it is the volatility that is the trading unit and the option's price is simply a calculated value used for settlement.
Options are often used in combination with the underlying asset to create more complex trades, as such it is very important to understand the sensitivity of the option price verus the valuation inputs. These sensitivities are typically referred to as the Greeks :
- Delta - option price sensitivity verus underlying asset price (this is expressed in units of price and not percentage)
- Vega - option price sensitivity to volatility (ie $ price change in option when volatility changes by one percentage point)
- Gamma - option’s delta sensitivity to the change in the underlying asset’s price (this is the convexity of the delta)
- Theta - option price sensitivity to time (ie an option's time decay which is always negative)
- Rho - option price sensitivity to the input interest rate