Frequently Asked Questions
If you cannot find the answer to your question, please email us at support@firstratedata.com.
The payment methods available depend on your location. In general all major credit cards, PayPal and Amazon Pay are accepted, as well as bank transfer in some countries. All payments are processed by our payment partner FastSpring, so you can see exactly which methods are available to you by clicking the 'Buy Now' button on any product page.
Checkout is in your local currency. Bank transfers can take a couple of business days to clear; once payment is confirmed your account is set up and your access details are emailed to you automatically.
The price shown on the 'Buy Now' button on each product page is the price you will pay in your local currency, and it already includes any applicable local taxes such as sales tax or VAT. Nothing is added on top at checkout.
Because local taxes differ between countries, the local price varies by location, so any US dollar price is indicative only. FastSpring acts as the merchant of record, collecting and remitting the tax on each transaction.
A dataset purchase is a one-off payment with no rebilling. It includes the full history to date plus one month of free daily updates.
If you would like updates after the first month, you can take out an update subscription separately from your customer page. Subscriptions are entirely optional: you can let one lapse and resubscribe later, and because every subscription includes the full history to date there are no gaps in your data and nothing to pay for the period in between.
Updates are approximately $99 per year for individual tickers, and between $59 and $119 per month for bundles. The update price for each bundle is shown on its product page and, as with purchases, includes any applicable local taxes.
Annual update subscriptions are priced at ten months for twelve months of updates.
Yes. You can upgrade at any time and pay only the difference between what you have already purchased and the larger bundle, so you are never charged twice for data you already own. Just email us with the bundle you would like to upgrade to.
An upgrade covers the historical data. An existing update subscription does not carry over automatically, so you would take out a new subscription for the upgraded bundle once your current subscription period ends.
Yes. The payment processor automatically emails a receipt when you purchase, using the cardholder's details. If you need an invoice showing your company or institution name, address, tax or VAT number, or a purchase order reference, email us once your order is complete with the details required and we will issue an invoice from FirstRate Data.
We provide two weeks of recent data as a sample for each dataset. The consolidated samples can be viewed on our Free Sample Data page. Please note these are the only samples we provide
We do not provide custom samples outside the samples already provided on our Free Sample Data page.
Please review the online version of our License Agreement, which applies to all data purchases. There is no separate agreement to sign.
The license permits derivative works and commercial use of all our datasets. What it does not permit is redistribution of the raw data itself.
Permitted, including commercially and to paying subscribers:
- charts, graphs, infographics and other visualizations
- research and analyst reports, backtest results, and derived statistics such as returns and volatility
- publishing small excerpts of the raw data
- training AI models on the data and publishing their outputs
- loading the data into your own database or systems, and showing your users only rendered charts and derived results
Not permitted: giving users access to the raw data — for example CSV downloads, an API returning bars, or tables of price and volume data. Removing a field such as volume does not change this, and neither does offering a download alongside a chart.
If your product shows only rendered charts and derived results, with no exports or access to the raw data, no separate agreement or additional fee is needed. Attribution is appreciated but not required. Please refer to our License Agreement for full details.
The license allows for multiple users of the data provided all users are within a single corporation or institution. The license does not allow for multiple unconnected parties to share the data. Please refer to our license for full details.
After your purchase you are automatically emailed a link to your unique customer page, which has links to your historical dataset as well as the daily updates. This should arrive within five minutes — please check your spam folder in case the email has been diverted.
Orders paid by invoice through our alternate payment processor are set up manually and can take 12–24 hours.
Every purchase includes one month of free daily updates. Download links are only live while there is an active subscription, so please download the data you need within that first month, or take out a subscription to keep access.
Your purchase comes with a unique link to your personal customer page; please keep it private. The page contains links to zip archives of your data.
If you have purchased a single ticker, the zip archive is typically under 200MB and contains all timeframes (1min, 5min, 30min, 1hour and 1day).
For bundles, each zip archive contains multiple tickers. To prevent data corruption we keep all zip archives below 4GB, so bundles may be split into multiple zip files, as the Stocks Complete download page below shows. Delisted tickers are in separate archives under the 'Delisted' tab, and supporting files such as futures contract maps and corporate actions files are under the 'Other Data' tab.
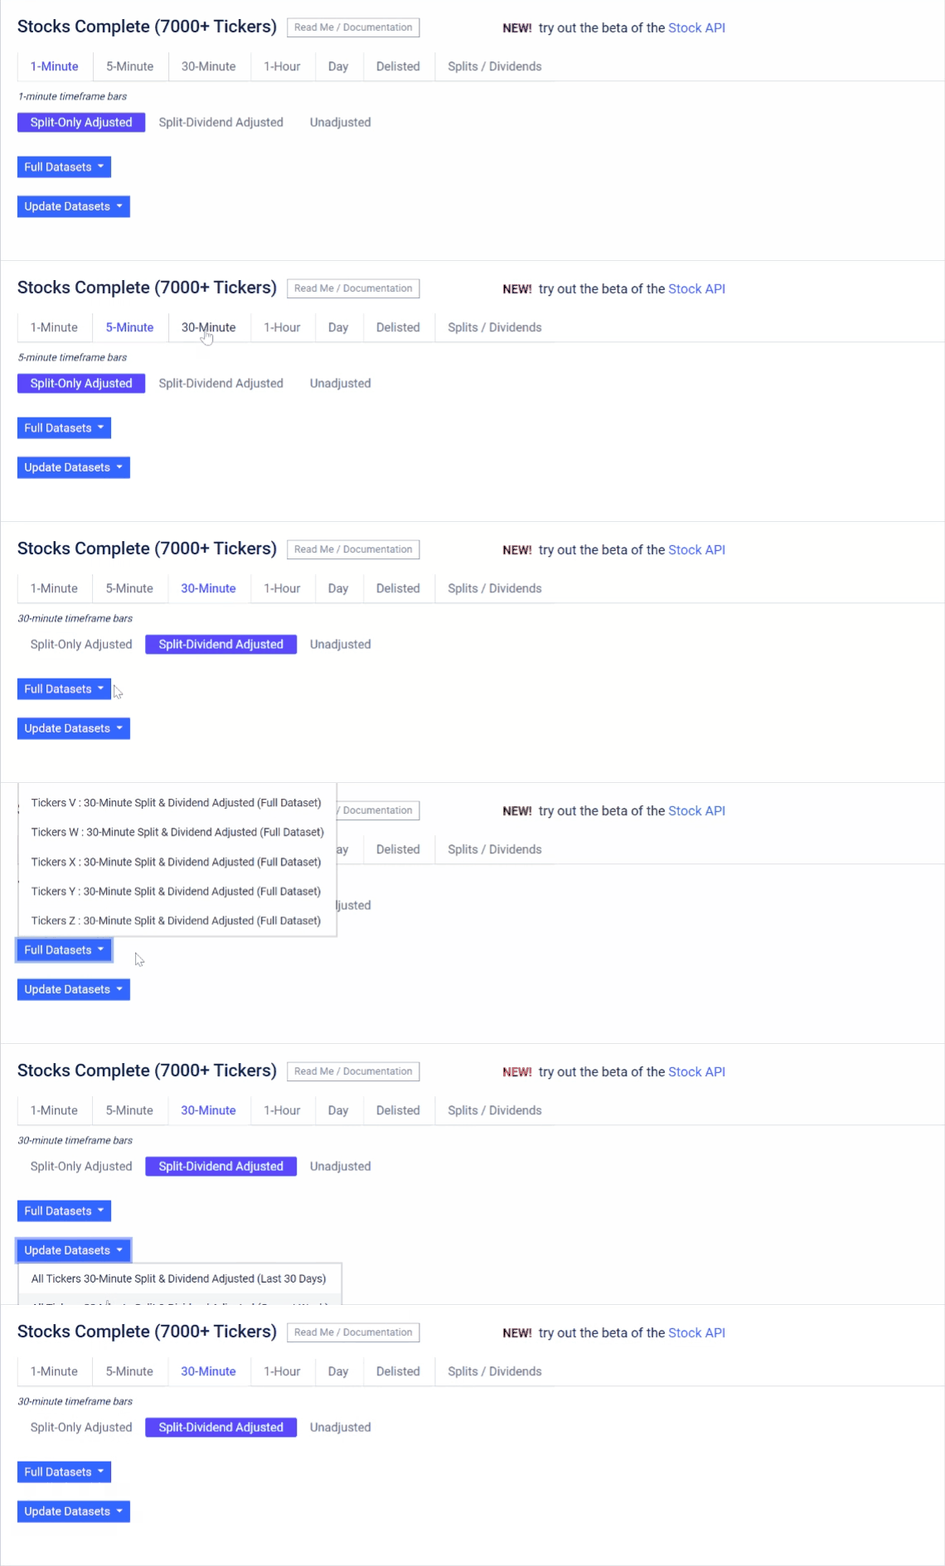
Stocks Complete bundle download page
For bundles we also offer an API for efficient, automated downloads — see Is there an API? below.
| Bundle | Size (zip compressed) | Size uncompressed |
| Complete Bundle + Options | 70 GB | 640 GB |
| Complete Bundle (stocks, ETFs, futures etc) | 40 GB | 440 GB |
| Complete Stocks+ETFs | 34 GB | 380 GB |
| Complete Stocks | 28 GB | 290 GB |
| Complete ETFs | 7 GB | 80 GB |
| SP 500 Stocks | 7 GB | 80 GB |
| Nasdaq 100 Stocks | 3 GB | 39 GB |
| Futures Active | 5 GB | 60 GB |
| Crypto Active | 4 GB | 30 GB |
| FX | 0.3 GB | 1 GB |
There is API access for the bundles but not for individual tickers (data for individual ticker purchases can only be downloaded via the Customer Download Page). The API lets you automate downloads and integrate the data into your workflows, and its documentation is linked from your customer page.
The API serves zip archives of data files rather than individual rows of data. Full-history archives are organized by ticker range (for example, all tickers beginning with 'A'), while update archives cover the last trading day, the current week or the last 30 days for all tickers in a single file.
For automated jobs we recommend calling the last_update endpoint first to confirm the date the data has been updated to. There are no rate limits.
No. Bundle archives are organized by ticker range and each contains the complete history, so it isn't possible to request an individual ticker or a custom date range, either from the customer page or through the API. For recent data, the daily, weekly and 30-day update files are much smaller than the full archives.
All datasets are updated daily after each trading day, with updates usually available by around 11.30pm US Eastern time for that day's trading. Options updates are usually available a few hours later. Updates run on weekdays, except crypto, which is updated seven days a week.
Update times are approximate and can run later when there are many adjustments to process or a data feed is delayed. If you automate your downloads, the API's last_update endpoint is the reliable way to check that the data is ready.
Updates are provided as separate zip archives covering the last trading day, the current trading week, or the last 30 days, so you can choose the file that matches how often you update. They are available from your customer page and through the API, and the download links are static, so they are easy to build into an automated workflow. Update files are usually small (under 15MB zipped).
Update files can be appended to an existing local archive. When a split or dividend occurs, however, the ticker's entire adjusted history is recalculated — see How do I keep an adjusted archive up to date? below.
You keep the right to use the data: the license is perpetual, with no time limit on use and no need to stay subscribed. The download links on your customer page are deactivated when there is no active subscription, however, so please download and store the data you need while your subscription is active.
The subscription includes the complete data series to the current data, so you can let a subscription lapse and then resubscribe at any time in the future to receive the complete data series to the current date without gaps.
To restart a subscription, click the subscribe button on your customer page and check out; the subscription is activated automatically. To cancel, use the subscription management link on your customer page, or email us and we will cancel it so that it does not rebill. There is no penalty for letting a subscription lapse.
All data is in csv (comma-separated values) format, zipped for fast downloading, and is compatible with Excel and most analysis packages.
Each data file covers a single ticker and timeframe, and files are named {ticker}_{period}_{timeframe}_{adjustment} — for example ES_full_1min_continuous_absolute_adjusted.txt. The columns are:
- Intraday bars: DateTime (yyyy-MM-dd HH:mm:ss), Open, High, Low, Close, Volume
- Daily bars: DateTime (yyyy-MM-dd HH:mm:ss), Open, High, Low, Close, Volume, Open Interest
- Options: Trade Date, Strike, Expiry Date, Call/Put, Last Trade Price, Bid Price, Ask Price, Bid Implied Volatility, Ask Implied Volatility, Open Interest, Volume, Delta, Gamma, Vega, Theta, Rho
Index data has no volume, as volume is not part of the specification for most indices. Timestamps mark the start of each bar. In adjusted data, volume can include decimal places where it falls below 100, to preserve precision after large split adjustments, so it is safest to read the volume column as a floating-point number.
Full format details are in the ReadMe linked from your customer page, and in the sample download on each product page.
All data is in US Eastern time (EST or EDT depending on the time of year), except crypto data, which is in UTC. Timestamps mark the start of each bar.
Intraday and daily data are separate series. Intraday bars aggregate the trades in the exchange trade stream, while official daily data follows the exchange's own eligibility rules and includes trades reported after the fact, such as block trades. As a result, daily volume is usually higher than the total of the intraday bars, and occasionally the daily open, high, low or close differ as well.
For the same reason, daily bars cannot be rebuilt by aggregating intraday bars. Our 5-minute, 30-minute and 1-hour bars, by contrast, can be reproduced from the 1-minute bars.
We don't include bars where no trades took place, so a missing minute means there was no trading in it. That is why a file may start at 09:31 rather than 09:30, and why less liquid tickers have frequent gaps, particularly outside regular trading hours.
Some indices also have no bar for the first minutes of the session, because the index cannot be calculated until enough of its components are trading or quoted.
The intraday bars are all stamped as of the start time of the bar. Therefore the 09:30 1min bar runs from 09:30.00 to 09:30.59 inclusive.
We provide the data as csv files only, and don't supply software, conversion scripts or platform-specific formats. Most customers use Python: the Pandas library handles aggregating and reformatting well, and AI coding assistants are good at writing scripts for this. We also offer data tools at tools.firstratedata.com.
Yes, where we can source them. Sourcing high-quality intraday data for delisted tickers is a challenge, which is why many vendors do not offer it at all. We carry the delisted tickers shown in our listing, but this is not the complete universe of tickers since 2000, and more tickers are missing the further back in time you go.
Delisted tickers carry a -DELISTED suffix, which leaves the original symbol free when it is reused, and their data is in separate archives under the 'Delisted' tab on your customer page. The delisted tickers covered are listed in the ReadMe included with the sample download.
When a company changes its ticker, its entire history is filed under the most recent ticker — for example, all Facebook history since its IPO is under META. Ticker changes from 2022 onwards are fully merged; before 2022 the larger ticker changes are mapped, and we continue to extend this. Some complex historical corporate actions, particularly for delisted tickers, are harder to resolve to a final ticker.
We cover securities listed on the main US exchanges; OTC-only securities are not included. The tick data for stocks and ETFs is aggregated from trades on the exchanges below:
XASE (NYSE American - AMEX)XNAS (NASDAQ OMX BX)
XCIS (National Stock Exchange)
FINRA (FINRA)
CQS (Consolidated Quote System)
XISX (International Securities Exchange)
EDGA (Cboe EDGA)
EDGX (Cboe EDGX)
XCHI (Chicago Stock Exchange)
XNYS (New York Stock Exchange)
ARCX (NYSE Arca)
XNGS (Nasdaq)
CTS (Consolidated Tape System)
OOTC (OTC Bulletin Board)
XOTC (OTC Bulletin Board)
PSGM (OTC Bulletin Board)
PINX (OTC Bulletin Board)
OTCB (OTC Bulletin Board)
OTCQ (OTC Bulletin Board)
IEXG (IEX)
XCBO (Chicago Board Options Exchange)
PHLX (Nasdaq PSX)
BATY (Cboe BYX)
BATS (Cboe BZX)
XBOS (NASDAQ BX Options/ETF)
Where possible we source data directly from the exchanges. Where we cannot — for example for delisted tickers — we source from upstream enterprise data vendors. Options data is sourced from the CBOE feed. FX data is aggregated from four major money-center banks, as FX is not exchange-traded.
Yes, samples are available for all our datasets from the 'Download Sample' link under the 'Buy Now' button on each product page. We also provide a consolidated page of all data samples on our Free Sample Data page. We do not provide any samples outside of this listing.
For stocks and ETFs, all datasets contain both unadjusted and adjusted data. Adjusted data is provided in two versions: split-only adjusted, and split+dividend adjusted. Volume is adjusted as well as prices. Please refer to the price adjustment page for more details.
We carry corporate actions data for splits and dividends only. These are supplied as separate splits and dividends files for each ticker, giving the ex-dividend date and cash amount, or the split effective date and ratio, and can be found under the 'Other Data' tab.
We do not carry data for other corporate actions such as mergers or spinoffs, and our adjusted series are adjusted for splits and dividends only.
For tickers without a split or dividend, you can simply append the daily update files. When a split or dividend occurs, however, that ticker's entire adjusted history is recalculated, so an append-only archive will fall out of step. Instead, overwrite the affected tickers using the full-history archive of just the adjusted tickers, available through the 'Full Updates' call described in the API documentation.
To generate continuous futures series we chain together front-month contracts. Every futures purchase includes three continuous series for each ticker, in every timeframe: an unadjusted series of the raw contract prices, a ratio-adjusted series, and an absolute-adjusted series. Both adjusted series remove the price jumps that otherwise occur at each contract roll.
We roll to the next contract on a fixed date for each ticker, set from that ticker's historical volume changeover. This is almost always before expiry — for many CME contracts, such as ES and NQ, roughly 7–10 days beforehand. A file listing every contract used to build each continuous series is under the 'Other Data' tab and is updated daily.
Absolute-adjusted series can show negative prices for some historical periods, which is expected with absolute back-adjustment; ratio-adjusted series do not go negative.
See our futures adjustment page for full details.
Continuous series are artificial, and vendors differ in when they roll between contracts: many roll at expiry, whereas we roll earlier to follow where trading volume actually moves. Different roll dates produce different adjustment factors, and because those factors are cumulative, adjusted series from different vendors drift further apart the further back you go.
To compare like for like, compare individual contracts, which are the actual traded prices published by the exchange. If you need a different roll rule, we provide a tool for building custom continuous series.
Yes. Every futures purchase includes the full chain of individual contracts (for example ES_H25, ES_M25, ES_U25 etc) as well as the continuous series. Intraday files are created for a contract once it is trading; daily files cover contracts several years out, as the exchanges publish a daily settlement price even before a contract trades.
Daily futures bars follow each contract's official trading day rather than the calendar day — for most CME contracts, 6pm US Eastern on the previous calendar day to 5pm. The daily close is the exchange's official settlement price, not the last traded price.
Exchanges publish settlement prices at no fixed time, and occasionally after our daily cutoff; when that happens, that day's daily bar appears in the following day's update.
We do not provide any futures metadata such as contract settlement details, trading calendars etc..
Our options data covers US stock, ETF and index options and is sourced from the CBOE feed. It is end-of-day data: for each contract we provide the last trade price, closing bid and ask, volume and open interest, together with implied volatility and full Greeks. There is no intraday options data.
Quotes are sampled about two minutes before the close, to avoid the deterioration in quotes that often occurs right at the close, so they may differ from vendors that sample at a different time. Last trade prices can be stale for less active contracts, so the bid and ask are usually a better guide to the market price.
Options are sold as a bundle only; we do not sell options for individual tickers. Options on futures, and FX and commodity options, are not covered. The full ticker listing is in the ReadMe included with the options sample.
Implied volatility is calculated using Newton-Raphson iteration, and the Greeks use Black-Scholes, with no skew adjustment. Both are provided for the closing bid, the closing ask and the last trade price. The risk-free rate is the 3-month US Treasury bill rate. Dividend yields are not used, as historical dividend-yield data proved unreliable. The rates used are not included in the dataset.
Zero bids, or zero implied volatility and Greeks, are normal for illiquid contracts where market makers are not quoting, and for deep out-of-the-money contracts whose value is close to zero.
No. Option strikes are not changed for splits, so the options data is unadjusted, which is normal practice for historical options data. The CBOE does not change the underlying ticker for a split, so the original root stays in use, and options with expiries beyond the split date are removed from the listing.
Adjusted option roots created by a split trade in a separate book that is not passed to the regular price feeds, so they are not included. We also do not merge option tickers: each option appears under the ticker it actually traded under on each day.